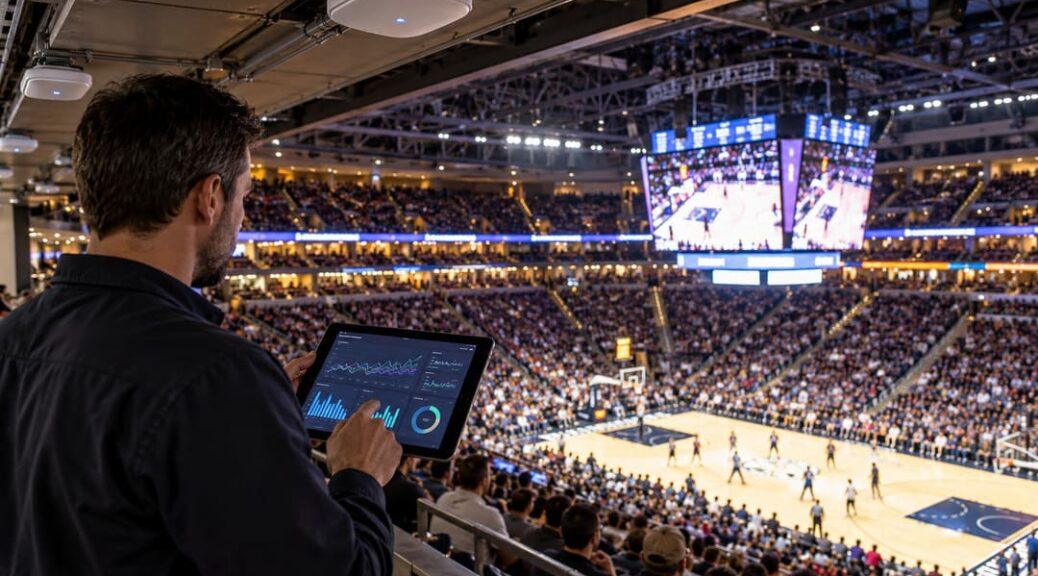
A smartphone can display a strong 5G signal and still struggle to load a ticket, send a photograph, or retrieve live sports information. That contradiction becomes especially visible inside crowded arenas, where thousands of devices compete for wireless capacity. For telecom professionals, stadium Wi-Fi vs 5G performance is becoming an important test of whether network infrastructure can support real applications rather than simply deliver impressive download speeds.
Modern sports venues depend on connectivity for much more than spectators sharing photographs. Mobile tickets, concession payments, live statistics, messaging, and streaming all place different demands on infrastructure. Fans interested in how experts rank NBA betting apps may encounter comparisons of mobile usability, pricing, and financial transactions. Those product reviews, however, cannot establish whether a cellular or Wi-Fi connection will successfully complete an application request during a crowded event.
Evidence from a 2026 stadium connectivity field study illustrates why that distinction matters. Researchers evaluated cellular and Wi-Fi performance during sold-out Notre Dame football games using commercial smartphones, real applications, and network measurements. Their findings challenged the assumption that faster cellular technology necessarily produces a more reliable experience when a venue reaches capacity.
What the Notre Dame Stadium Tests Revealed
A research team associated with the University of Notre Dame and Sebelas Maret University examined wireless connectivity at Notre Dame Stadium, which accommodates up to 77,622 spectators.
The study, published as a research preprint on July 17, 2026, analyzed measurements collected during the 2025 football season, with additional baseline testing in February 2026.
Its environment was unusually demanding. Approximately 900 outdoor Wi-Fi access points served the stadium seating area, alongside cellular infrastructure supporting AT&T, T-Mobile, and Verizon.
The researchers used six commercial smartphones to evaluate browsing, messaging, image uploads, and network performance during games and periods when the stadium was empty.
The most revealing results involved whether applications completed their tasks.
During game-day browsing tests, the researchers recorded these failure rates:
- 6 GHz Wi-Fi: 3.9%
- Verizon cellular: 24.7%
- T-Mobile cellular: 25.0%
- AT&T cellular: 36.6%
A browsing attempt taking longer than the study’s 90-second cutoff counted as a failure.
These figures do not establish nationwide carrier rankings. They describe measurements at one stadium, using particular devices, applications, network configurations, and test locations.
Nevertheless, the difference is operationally significant. A network delivering strong theoretical performance can become unreliable when many users attempt ordinary tasks simultaneously.
Why Game-Day Upload Traffic Deserves More Attention
Mobile network performance is frequently presented through download speeds. Yet spectators at sporting events generate substantial outbound traffic.
Uploading photographs, sending videos, messaging friends, and sharing social media content all require uplink capacity.
The Notre Dame measurements exposed considerable differences between networks.
During the researchers’ WhatsApp image-transfer tests, AT&T recorded a 46.2% failure rate and Verizon recorded 44.4%. T-Mobile and the tested 6 GHz Wi-Fi connection recorded no failures for that specific task.
Wi-Fi was not flawless across every application. Instagram posting still produced a 14.7% failure rate over the 6 GHz connection during game-day testing.
The lesson is that one successful application test does not guarantee reliable performance across different workloads.
Other stadium deployments reinforce the importance of uplink planning.
Ericsson documented more than 29 terabytes of mobile traffic during a major women’s football tournament in Australia in 2023. Approximately 25% of that traffic was uplink, equivalent to roughly seven terabytes of uploaded data across the monitored event environment.
That historical deployment is not directly comparable with the Notre Dame measurements, but both illustrate why capacity planning cannot focus exclusively on downloading content.
For operators, this changes the engineering discussion. Adding downstream capacity may improve video delivery while leaving image uploads, interactive messaging, and transaction requests exposed to congestion.
Stadium Wi-Fi vs. 5G Performance: Why Architecture Matters
The Notre Dame results do not suggest that Wi-Fi is always superior to cellular connectivity.
They show how deployment architecture, available spectrum, network density, and traffic management influence performance under load.
T-Mobile’s 5G Standalone configuration performed comparatively well in the tested environment. Its median time to first byte during game-day browsing was 504 milliseconds, compared with 573 milliseconds over the tested 6 GHz Wi-Fi connection.
Meanwhile, the study identified more severe problems on certain 5G Non-Standalone connections that relied on LTE infrastructure.
Verizon’s 90th-percentile time to first byte reached 5,983 milliseconds during the game-day browsing measurements. That means the slower end of successful requests experienced substantial delays before receiving initial content.
Importantly, time to first byte is not simply radio latency. It reflects the time between an application request and the arrival of its first response data, potentially including network and server-side processing.
Operators should therefore avoid treating every slow response as proof of insufficient wireless capacity.
The engineering goal is a complete understanding of service delivery.
A dense Wi-Fi deployment can provide additional capacity and offload cellular traffic, while well-designed 5G infrastructure can serve mobile users without requiring access to a venue’s wireless network.
These systems are complementary. Their relative effectiveness depends on how they are deployed, maintained, and measured.
Four Application Tests Every Stadium Network Team Should Consider
A practical assessment should reproduce activities that spectators actually perform.
Instead of relying exclusively on signal-strength measurements or speed-test screenshots, operators can build a service-focused testing program.
| Fan activity | Possible failure | Performance indicator | Operational priority |
|---|---|---|---|
| Digital ticket validation | Delayed or rejected entry request | Transaction completion and response time | Test entry gates during arrival surges |
| Messaging and photo sharing | Upload timeouts or stalled messages | Uplink performance and completion rate | Identify congestion in crowded seating sections |
| Live statistics and video clips | Slow loading or interrupted playback | Content delivery time and request errors | Separate radio problems from application delays |
| Transportation and navigation | Connection failure during departure | Handover success and session continuity | Examine exits, parking areas, and surrounding streets |
These are proposed operational tests, not measurements reported by the Notre Dame researchers.
The testing schedule matters as much as the individual metrics.
Before an event, engineers should establish baseline performance across seating sections, entrances, concourses, and nearby transportation areas.
During the event, teams should repeat application tasks while monitoring congestion, failures, latency variation, and changes in radio conditions.
After the event, attention should move toward departures, network handovers, and the impact of concentrated traffic outside the venue.
Teams developing these procedures can build on NATEWIN’s existing guide to network latency testing, which explains the importance of loaded latency, packet loss, and application-level measurements.
Testing should use authorized applications, synthetic transactions, or controlled test accounts where appropriate. There is no need to execute real-money wagers or access private customer activity to assess basic network reliability.
The Real Challenge Is Measuring the Complete User Experience
A cellular radio can operate normally while the application behind it struggles.
A slow request may originate from network congestion, DNS resolution, an overloaded application server, an authentication failure, or an external service dependency.
This is why network and application teams need coordinated monitoring.
Google’s Site Reliability Engineering framework identifies four useful monitoring signals: latency, traffic, errors, and saturation.
For stadium operations, those signals become more valuable when correlated with the event timeline and physical location.
A rise in request errors shortly after spectators enter the arena may indicate a different issue from delays affecting thousands of users during halftime.
Similarly, successful radio connectivity does not guarantee that a ticketing system, mobile payment gateway, or content platform is available.
Incident analysis should preserve timestamps, application outcomes, access-network conditions, and relevant backend records. Without that evidence, infrastructure teams risk adding expensive capacity to solve a problem originating elsewhere.
Network resilience also requires appropriate fallback planning. Venue operators should coordinate with application providers to ensure that critical functions, particularly ticketing and essential venue operations, have suitable recovery procedures when connectivity is disrupted.
The Next Stadium Upgrade Should Begin With Evidence
Crowded venues provide an unusually demanding environment for mobile networks because user behavior changes rapidly throughout an event.
Traffic patterns before the opening whistle or tip-off differ from those during breaks, memorable plays, and the mass departure afterward.
The Notre Dame research shows why engineers should measure application success under real crowd conditions, not just theoretical network capability.
It also demonstrates the value of evaluating Wi-Fi and cellular connectivity together. Neither access technology should receive automatic priority without evidence from the actual venue and workload.
For telecom operators, venue technology teams, and event organizers, the practical objective is straightforward: determine which applications need to work, identify the conditions under which they struggle, and invest where measurable service improvements are possible.
A successful stadium network is not necessarily the one advertising the fastest peak download speed. It is the one that continues completing the tasks people depend on when the venue is full.